Last updated: 2 June 2025
IVF Success Rates – Myths & Figures Revealed – Summary
- Success Rates Can Be Misleading: IVF success statistics are often presented in ways that inflate perception (e.g. showing data per embryo transfer instead of per treatment cycle).
- Age Matters – A Lot: A woman’s age remains the biggest predictor of IVF success. Success rates drop significantly after age 35, and especially after 40.
- Donor Eggs Change the Equation: Using donor eggs (usually from younger women) can bypass age-related fertility decline, leading to higher success rates.
- Success ≠ Live Birth: Many clinics advertise clinical pregnancy rates, not live birth rates, which are 10–15% lower due to miscarriages or complications.
- Cumulative Success Rates Add Context: Success rates improve over multiple cycles, with cumulative chances reaching 70–90% after 3 attempts depending on age and clinic.
- Clinic Comparisons Are Tricky: Clinics vary in how they define success, whether they include frozen cycles, PGT use, or count embryo banking, making direct comparisons unreliable.
What are IVF success rates and how are they calculated?
IVF success rates are usually calculated as a percentage of clinical pregnancies dividing the number of favourable results such as the number of clinical pregnancies by the number of procedures performed such as the number of embryo transfers, according to the following formula:
number of pregnancies1 or number of live births2 / numbers of embryo transfers3
- The number of pregnancies – most often a clinical pregnancy in 6-8 weeks of pregnancy as it is rare for clinics to present data from the 12th week of pregnancy.
- Live birth means carrying a pregnancy to term and delivering a child.
- Embryo transfer means that there was at least one embryo regardless of its quality transferred.
Typically, such statistics show an average success rate between 30-50%. In the majority of clinics, statistics are presented for different age groups of the patient, in which case the differences in age-dependent success rates will be very large. Generally, the younger woman is, the likelihood of successful treatment is statistically higher. If you consider undergoing an IVF egg donation program – IVF Donor Eggs success rates – please read this article.
At first glance, everything looks clear but if we analyse the presented data it will turn out that the statistics so presented do not include IVF cycles where the embryo transfer did not take place for various reasons. Further on, the article discusses the number of possible cycles.
Other ways to calculate IVF success rates:
- clinical pregnancies/number of IVF cycles started
- live births/number of IVF cycles started
IVF success rates as presented by clinics
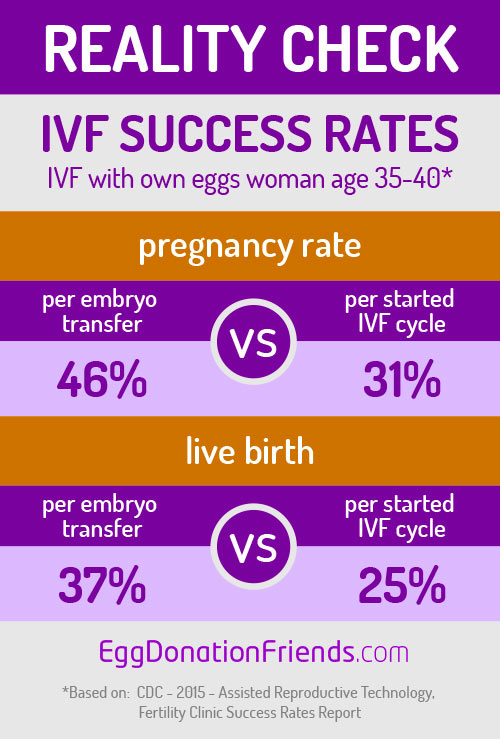
From the point of view of the patient, IVF Success rates should mean the probability that your IVF treatment will be successful, that is, ending in a live birth, which is the aim of treatment. Most clinics in Europe present IVF Success rates as a percentage of patients who become pregnant. Most often, the probability of getting pregnant is calculated in relation to the number of embryo transfers made and not the IVF cycles started – it is the so-called IVF Pregnancy Rates.
Not every Patient starting the IVF cycle will have embryos available – that’s why the statistics calculated on the started IVF cycle (including the cycle in which no embryos were given) will be much lower. On average, 10-35% of the started IVF cycles may end before the embryo transfer (source: CDC Report 2021).
Moreover, the presented data usually focus on statistical chances for pregnancy and not on the birth of a child. This is another element that will significantly reduce statistics – an average of 10% – after all, pregnancy can end in a miscarriage. As you can see, there are many factors to take into account, which can have a huge impact on the presented values.
From the point of view of the IVF clinic, IVF Success rates mean most often that the patient got pregnant, which is known as pregnancy rates because this is the objective of the IVF method. Is such an approach ethical from the point of view of the patient? Isn’t this way of presenting statistics intended to sell “false hope” to patients? What does this mean for the Patient from the medical and financial point of view?
IVF success rates vs IVF pregnancy rates
The comparison between IVF success rates and pregnancy rates reveals complex outcomes that vary based on age and individual fertility factors. Understanding these differences can help patients and clinicians navigate treatment decisions effectively.
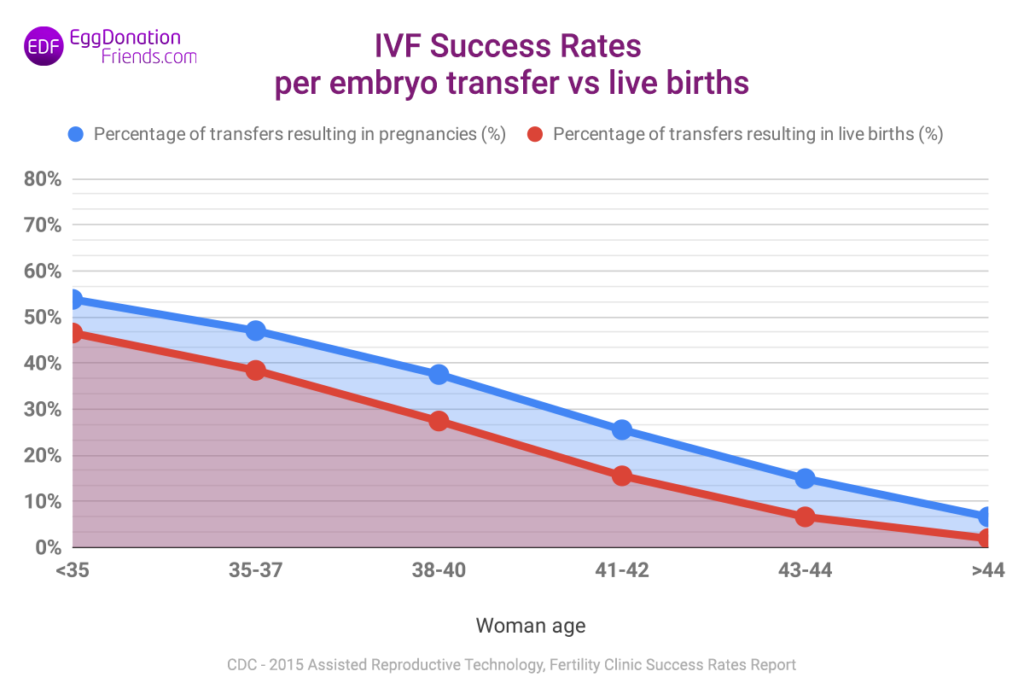
IVF success rates per embryo transfer
The graph below (Chart 1) makes it easy to see that the performance indicators change significantly with the age of the woman. For women younger than 35 years, the chance of getting pregnant (counted per embryo transfer) is around 54%, but already at the age of 45, it is only around 6%. If we take into account the live birth statistics, they will be around 46% for ages under 35 and around 2% for ages over 44. As you can see, the statistical differences between pregnancy and childbirth can be significant. The chart below presents a comparison of IVF success rates calculated as pregnancies per embryo transfer and live births.
IVF success rates per started IVF cycle
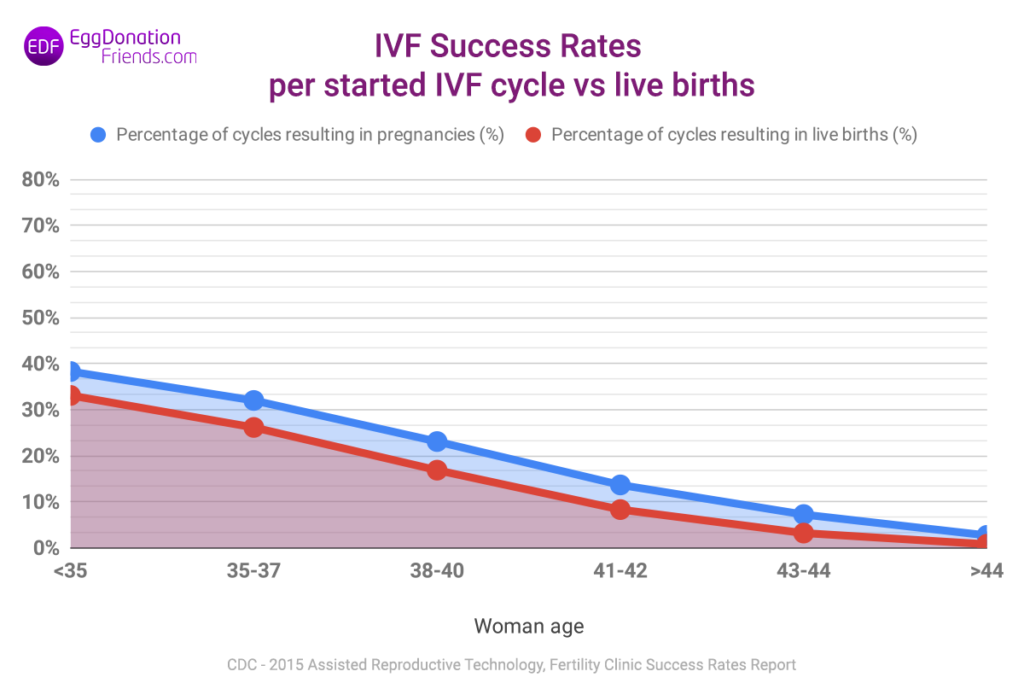
The situation is much different when we consider treatment success rates per the cycle started (Chart 2) and not the transfer of embryos. In this case, the probability of pregnancy for a woman under 35 is approx. 38% with a live birth rate of 33% while the same for a woman over 44 years of age is approximately 3% and 1% respectively. It is easy to notice that these values are much lower than IVF success rates calculated per embryo transfer. The chart below presents a comparison of IVF success rates – pregnancy for the IVF cycle started and the birth of a child.
Why IVF success rates per embryo transfer are higher than per started IVF cycle?
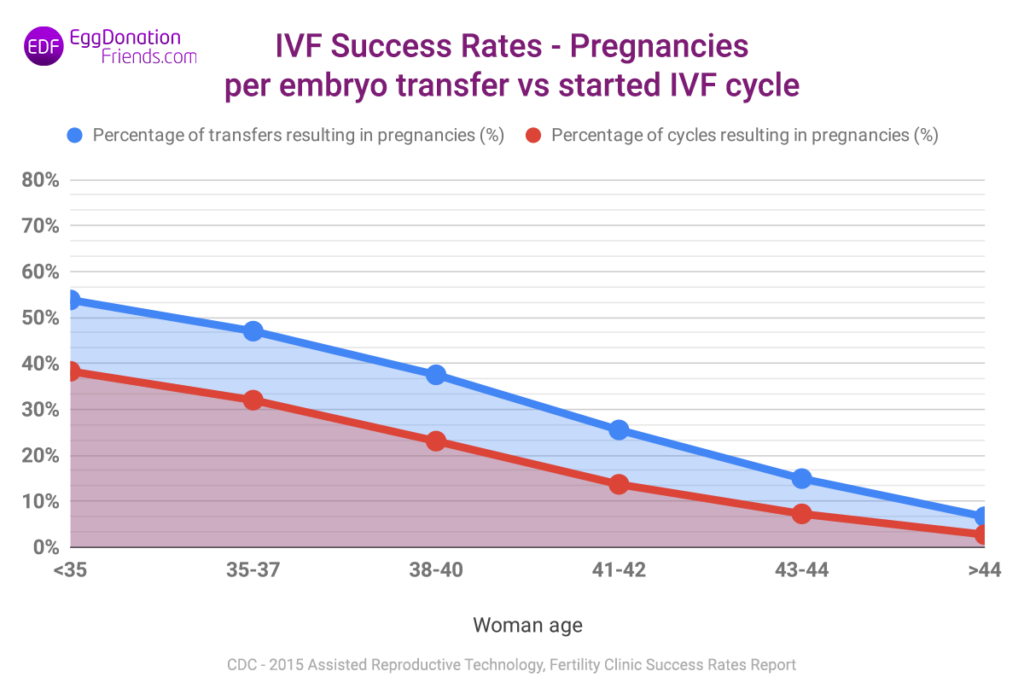
Statistically, there is a group of women of various ages who do not have oocytes collected in IVF programs and another group in whom, despite the collection of oocytes, transfer of embryos does not take place. These groups are usually not included in the statistics presented by IVF Clinics. Below we present a comparison of IVF success rates – pregnancies – (getting pregnant) per embryo transfer and per started IVF cycle, which exactly illustrates the difference in the success rate of treatment (Chart 3). As you can see in the graph below – IVF success rates calculated per started IVF cycle are much lower than those calculated per embryo transfer.
IVF success rates vs IVF cycle cancellation
As you can see the differences in success rates per woman’s age are huge. If we look at the figure calculated per IVF cycle and not per transfer (Chart 3 above), the differences in IVF success rates are really high. Isn’t it true that they deviate significantly from the information that can be found on the websites of IVF Clinics?
On average, the percentage of IVF programmes in which embryo transfer does not occur for various reasons is around 10-30% depending on the age of the woman. When calculating the IVF success rates based on embryo transfers, IVF programmes that ended earlier and thus before the embryo transfer, are not included in these statistics. In that case, are they highly overstated?
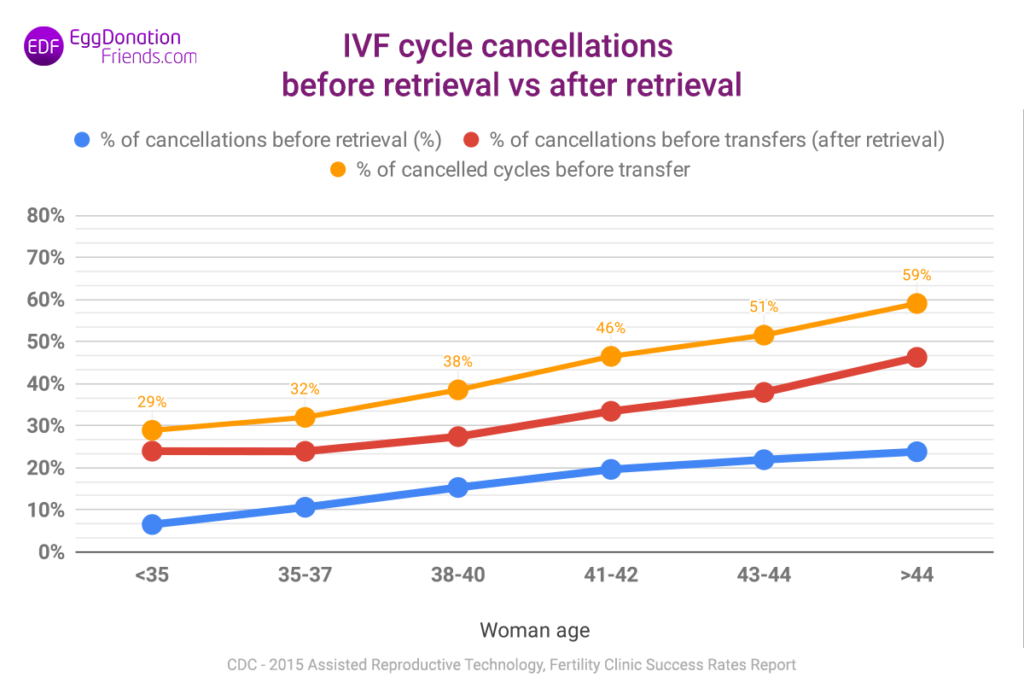
Let’s see what numbers we’re talking about at specific age intervals of the patient. In the chart below, we present what percentage of IVF programmes end for the following reasons (Chart 4):
- due to the lack of embryos to be transferred (orange line) – considering the following reasons,
- before the oocytes are collected (blue line)
- after collecting oocytes but before embryo transfer (red line)
Of course, these are average IVF statistics for all patients with various diagnosed causes of infertility. For the above data, the causes of infertility are broken down as follows:
- Tubal factor – 10.4%
- Ovulatory dysfunction – 14.3%
- Diminished ovarian reserve – 26.9%
- Endometriosis – 6.5%
- Uterine factor – 5.8%
- Male factor – 27.8%
- Other factors – 5.6%
- Unexplained factor – 10.5%
The analysis was prepared based on CDC (Centers for Disease Control and Prevention) data from 2015 and involved over 413,000 IVF cycles, broken down by the age of women in the USA. 77.9% IVF cycles were performed using ICSI technique.
Source: CDC – 2021 Assisted Reproductive Technology, Fertility Clinic Success Rates Report
IVF success rates – what you should consider
In particular, you should know how the statistics were calculated. IVF Success rates with your own oocytes should be presented per woman’s age. Usually, the age is divided into the following ranges: <35, 35-37, 38-40, 41-42, 43-44, and over 44 years. Why is it so important? The woman’s age has a decisive impact on IVF success rates. Age and success rate are diametrically opposed. The age of a woman is much less important in the case of IVF program success using donor’s eggs. Another element is the cause of the patient’s infertility: depending on the reason, the success rate can change significantly.
IVF success rates – the false hope?
The most difficult part of the IVF program is the process of stimulating and fertilizing oocytes and embryo development. So why do clinics usually skip this part in the treatment success rate statistics? In the pursuit of high values of treatment success rates presented on websites, clinics try to show the highest possible values. Imagine that we have 3 clinics and each of them shows statistics in a different way; the patient will usually choose the clinic that shows the highest value of treatment success rate while rarely inquiring what the values are really about.
Is it possible to estimate the costs of treatment based on IVF success rates?
It is very difficult, especially if the Patients base their calculations on statistics that clinics present most often, which is pregnancy per embryo transfers. It will be a little easier when we base the calculations on the live birth statistics. It will be even easier when the statistics are calculated with live births but taking into account the started IVF cycles for a specific age group. However, the ideal solution is to calculate costs based on the cumulative success rate of treatment, therefore the percentage of patients who were successful in, for example, 2-3 consecutive IVF cycles.
We have written a separate article about the cumulative success rates, which you will find here. However, it is very difficult to estimate the total cost of treatment. Even knowing the cumulative value of success for the 3 cycles of IVF which is, e.g., 82%, too much depends on the individual situation of the patient to develop such a calculation. What does 82% mean in this case? It means that for 100 patients, 82 will give birth to a live child. The question is whether you will really find yourself in this group.
Unfortunately, nobody knows the answer to this question today. It is not uncommon to find patients in clinics who attempt IVF 5, 6 or even 8 times but on the other hand, there are many patients who successfully finish the treatment on their first attempt.
Personalised IVF statistics based on individual parameters – IVF calculators
The best solution would be to check the expected treatment success rate in an individual way taking into account your age, the cause of infertility and other important parameters. Clinics do not offer such options but on-line IVF calculators are available, which can take into account such parameters. We checked how these calculators work and compared them with the article “IVF calculators – a comprehensive comparison”. They seem to be a good solution for people who want to check the expected success rate of treatment with an independent source. The approach seems to make sense because they are the only places that can at least partially take into account your individual medical situation.
What influences the IVF success rates using patients’ own oocytes?
Many factors influence the success rate of an in vitro programme using the patient’s own oocytes. These are, for example, the age of the woman, the individual medical situation and the history of treatment of genetic factors and others. It should be remembered that the quality of oocytes decreases with the age of the woman: the older the patient, the poorer the quality of her oocytes. This is related to many factors but the most important is the so-called aneuploidies in oocytes that can cause genetic disorders.
Below you’ll find the factors that have the biggest impact on the IVF success rate:
- Infertility causes and woman’s age
- The quality of the partner’s sperm (unless the sperm comes from a donor bank)
- Quality and number of oocytes
- Fertilization process and applied additional procedures used in an in vitro laboratory, e.g. ICSI, AH (assisted hatching) blastocyst culture- embryo development till 5th day, PGS
- Quality of embryos
- Patient preparation for embryo transfer – the right implantation window
What does the IVF treatment process look like?
IVF process consists of several stages, and each of which is of great importance for the success of the treatment program. The following information applies to the IVF programme with Patient’s own oocytes.
- Qualification, preparation for the IVF Programme, beginning of taking contraceptive drugs. Qualification, hormonal and genetic tests, partner sperm analysis. The patient should have indications to start this type of therapy.
- Beginning of hormonal stimulation. Deduction of the stimulation plan to retrieve the appropriate number of oocytes. Usually, the stimulation can last from 7 to 9 days.
- Collection of oocytes. Most often about 2-3 days after the end of the stimulation process. The collection is performed under general anaesthesia (unless the patient has contraindications to anaesthesia).
- Evaluation of oocyte quality and egg fertilization with the sperm of a partner or donor. The use of procedures that increase the effectiveness of therapy in an in vitro laboratory: ICSI, AH, blastocyst culture and others.
- Embryos development up to 3 or 5 days. Cultivation and quality control of embryos for up to 3 days or to the blastocyst stage – 5 days.
- Preparing the patient for embryo transfer.
- Embryo transfer on the 3rd or 5th day.
- Care of the patient after the transfer.
IVF success rates – where to look for confirmed data?
Most countries have organisations that monitor the clinics in terms of quality and success rate of IVF treatment. Below you will find a list of recommended organizations that publish statistics based on a very large number of conducted IVF cycles.
- ESHRE (European Society of Human Reproduction and Embryology)
The organisation brings together European clinics and conducts monitoring for IVF success rates - SART (Society for Assisted Reproductive Technology)
An American organisation that provides very accurate IVF statistics in the US. More than 80% of US clinics report to SART - CDC (Centers for Disease Control and Prevention)
The agency operates under the Ministry of Health of the USA. It publishes statistics based on SART data and data obtained directly from IVF Clinics in the USA - IVF calculators – online tools that allow you to calculate IVF success rate taking into account the individual medical situation of patients
If you need help choosing an IVF clinic abroad, spare 3 minutes of your time. You will save at least a few hours
If you are looking for an egg donation clinic abroad, use the EggDonationFriends unique patients tool – Clinic Matching Test. We analyse your needs and choose 3 overseas clinics which match your expectations. Our database of IVF centres includes only trusted fertility clinics which have experience in providing high quality services to international patients. The suggested IVF centres will contact you directly within 3 working days. Spare 3 minutes of your time – you will save at least a few hours! Our assistance is free of charge.
FAQ: Frequently Asked Questions
In this section, we address some of the most common questions about IVF and fertility treatments.
What is the success rate of IVF?
The overall success rate varies but averages around 40-50% per cycle for women under 35, decreasing with age. Factors like embryo quality, maternal health, and the clinic’s expertise can also influence success.
What is the success rate of IVF frozen embryo transfer?
The success rate is similar to fresh transfers, about 40-60%, depending on age and embryo quality. Many clinics now favor frozen embryo transfers due to advancements in cryopreservation techniques.
What is the IVF success rate with genetic testing?
Preimplantation genetic testing (PGT) can improve success rates, potentially increasing to 60-70% per transfer, especially for older women or those with previous failures. This helps ensure only genetically healthy embryos are implanted, reducing the risk of miscarriage.
What is the success rate of a second IVF cycle?
Success rates often increase slightly with a second cycle, especially if adjustments are made, ranging from 45-60% for younger women. The experience from the first cycle can help doctors fine-tune the approach for better outcomes.
What is the success rate of a third IVF cycle?
Success rates plateau around 40-50% by the third cycle but can still vary depending on individual circumstances. Persistence and exploring additional treatment options may further improve chances.
Article sources:
- https://doi.org/10.1093/humrep/dew358
- https://doi.org/10.1371/journal.pmed.1000386
- https://www.sart.org/
- https://www.cdc.gov/art/success-rates/
- https://sartcorsonline.com/Predictor/PatientV2Landing
- https://www.hfea.gov.uk/about-us/media-centre/key-facts-and-statistics/
- https://fertilityroad.com/ivf/ivf-success-rates-explained/
Table of Contents
- 1 IVF Success Rates – Myths & Figures Revealed – Summary
- 2 What are IVF success rates and how are they calculated?
- 3 IVF success rates as presented by clinics
- 4 IVF success rates vs IVF pregnancy rates
- 5 IVF success rates vs IVF cycle cancellation
- 6 IVF success rates – what you should consider
- 7 IVF success rates – the false hope?
- 8 What influences the IVF success rates using patients’ own oocytes?
- 9 What does the IVF treatment process look like?
- 10 IVF success rates – where to look for confirmed data?
- 11 If you need help choosing an IVF clinic abroad, spare 3 minutes of your time. You will save at least a few hours
- 12 FAQ: Frequently Asked Questions




Good article. If anybody thinking how clinics sell the false hope according to IVF Success Rates and IVF Treatment, the answer is above. I was told over an email my chances are like 41% – IVF with own eggs, on the visit in clinic nobody told me that according to my medical situation and background – I may expect maximum 5-8% as I consulted other IVF specialist / clinics. IVF success rates are not comparable between clinics and patients – so be aware that ivf success rates it’s not something you should make your decision on.
If you wondering how not to fall into ivf success rates trap, this is good article to start with, will recommend it and share. If you look for an IVF clinic and whant to compare the success rates – the first you need to know it’s difficult as there is no one database of clinic’s success rates to sompare them. From my point of view every IVF clinic can write on the website what whatever they want…and you can’t check it.